
TL;DR: Using Blender for Scientific Visualization turns complex data into clear, reusable business assets
Using Blender for Scientific Visualization helps you turn simulations, scans, point clouds, and analysis outputs into visuals people can understand, trust, and reuse. The article’s main point is simple: Blender is not just for making scientific data look good. It helps you explain results to clients, funders, regulators, and teams while keeping file history, authorship, licensing, and reuse under control.
• You get clearer communication through better camera work, materials, animation, and scene structure than many technical tools alone.
• You need a clean pipeline: validated source data, documented simplification, versioned files, and clear ownership rules.
• Your Blender scenes can support grants, investor decks, training, sales, and IP evidence if you store and share them properly.
If you want to go further with procedural scenes and repeatable 3D workflows, check out procedural animation with Geometry Nodes. Start by building one scene from source data to archived output, then tighten your file control and reuse rules.
Using Blender for Scientific Visualization: from raw data to visuals people trust
Using Blender for Scientific Visualization starts with a blunt question: are you still treating scientific data as something to inspect, or as something to communicate, protect, and reuse? In 2026, that distinction matters for engineers, research teams, startups, and EU manufacturers because a visual that explains a simulation can also become evidence in an IP dispute, a sales asset, a grant deliverable, or a regulated technical record.
From the point of view of CADChain co-founder Violetta Bonenkamp and CLO Dirk-Jan Bonenkamp, Blender sits in a very practical spot. It is an open-source 3D creation suite, but for scientific work it also acts as a bridge between raw computational output and decision-ready visuals. That bridge becomes more valuable when teams need traceability, authorship proof, controlled sharing, and clean licensing around datasets, render files, and derived 3D assets.
What is Using Blender for Scientific Visualization? It is the process of importing, structuring, shading, animating, and rendering scientific or engineering data in Blender so that simulations, scans, measurements, and models become readable 3D images, videos, and interactive scenes. For startups and SMEs, it serves as a cost-aware path to explain hard technical work without relying on expensive proprietary visualization stacks alone.
Why it matters for your company: Blender helps turn CFD results, astronomy data, medical geometry, microscopy structures, terrain scans, and point clouds into visuals that clients, grant reviewers, investors, regulators, and internal teams can actually understand. Unlike a static screenshot from a narrowly technical tool, Blender lets you control camera narrative, material logic, lighting, animation timing, and branded presentation quality.
Scientific visualization fails when the science is correct but the visual story is unreadable, untraceable, or legally exposed.
Violetta Bonenkamp, CEO and co-founder, CADChain
Protect your Blender work before it starts circulating.
Scientific visuals often move fast across labs, suppliers, agencies, and marketplaces. If authorship and file history are fuzzy, ownership disputes get expensive very quickly. BlendedBoris adds a blockchain timestamp to your Blender files from inside Blender, so each version carries dated proof of who made it.
👉 See how BlendedBoris protects your Blender files
Why does Blender matter for scientific visualization now?
The challenge many startups and research-heavy SMEs face is not lack of data. It is too much data, too little visual clarity, and almost no governance over downstream reuse. A simulation team may have terabytes of fluid flow, stress, thermal, or particle data, yet management still asks for a two-minute animation that explains the result to non-specialists.
That gap is documented in public training and educational material. The ARCHER2 scientific visualisation webinar on Blender points out that high-performance computing generates huge volumes of data and that Blender can make that output more engaging for audiences outside narrow research communities. The session also highlights practical workflows such as ingesting results through ParaView and scripted rendering on HPC resources.
Brian R. Kent's 3D Scientific Visualization with Blender book at IOPscience (Morgan & Claypool, 2015) made a similar case years earlier, and it remains relevant in 2026. Kent is a scientist at the National Radio Astronomy Observatory, and the book is a hands-on introduction to Blender for physical-science data. Blender gives scientists a visual language that looks closer to film and product design than to default lab screenshots. That matters because people trust what they can inspect visually, and they remember what they can follow spatially.
For EU teams, there is another layer. Cross-border projects under Horizon Europe, university-industry partnerships, medtech pilots, and supply-chain R&D often involve shared files and shared authorship claims. Once a rendered sequence, .blend file, exported mesh, or texture set leaves your system, the legal neatness disappears unless you planned for it.
Here is why this matters now:
- Open-source pressure is real: Many SMEs want visual quality without adding another expensive annual seat.
- Grant communication is stricter: Publicly funded projects increasingly need accessible dissemination materials.
- AI scraping and asset reuse are rising: Nice visuals travel fast, often stripped from their context.
- Procurement teams want evidence: File provenance, version history, and permission trails are becoming more relevant in technical collaborations.
- Blender matured: Its rendering, Python scripting, geometry workflow, volumetrics, and ecosystem make it a real option for serious scientific communication.
What scientific data works well in Blender?
Blender is not the first tool many researchers use to compute or analyze data. That is fine. In many workflows, it is the final narrative and rendering layer. The strongest use cases appear when data already exists in structured form and needs visual framing, material treatment, motion, and camera control.
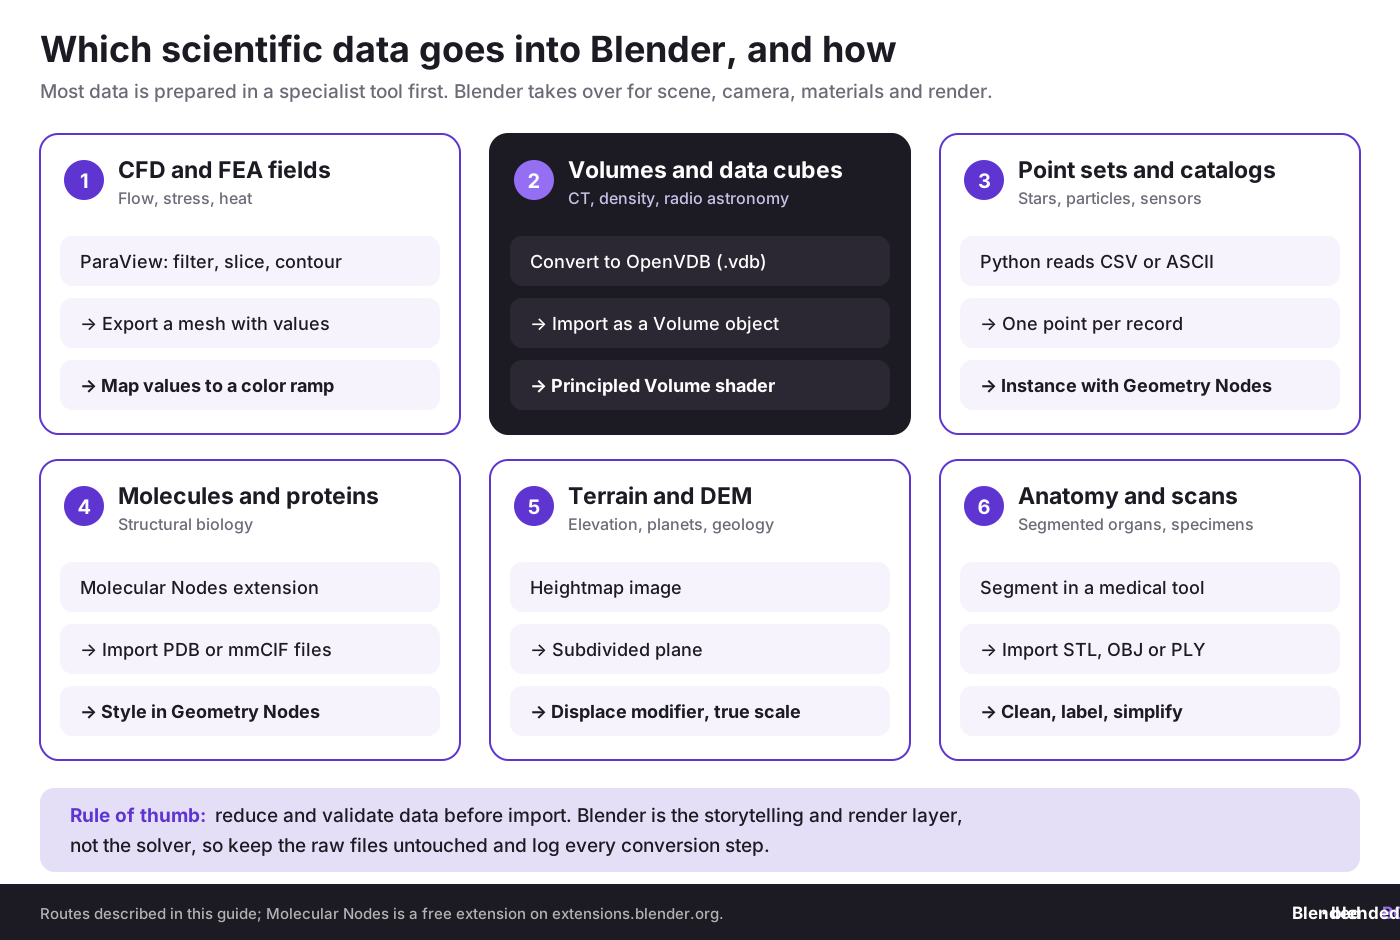
The most common data types include:
- CFD and flow fields: pressure zones, velocity surfaces, particle paths, smoke-like behavior, vessel flow, wind tunnel results.
- Finite element and structural analysis: deformation maps, stress concentration, fatigue regions, displacement animations.
- Medical and anatomical models: segmented organs, surgical planning geometry, vascular systems, prosthetic fit studies.
- Molecular and cellular structures: proteins, membranes, electrostatic fields, molecular docking visuals.
- Astronomy and astrophysics: stellar catalogs, data cubes, galaxy interactions, radio astronomy volumes.
- Terrain and geospatial surfaces: DEM-based landscapes, satellite-derived meshes, geological cross-sections.
- Microscopy and volumetric scans: CT, MRI, microscopy stacks, transparent data cubes.
- Point clouds and photogrammetry: scanned lab environments, archaeological sites, manufacturing spaces, specimen reconstructions.
If your work touches anatomy or healthcare communication, the workflow overlaps strongly with medical visualization in Blender, where accuracy, labeling, material distinction, and informed simplification matter more than flashy surface detail.
What do authoritative sources say about Blender in science?
The source base around Blender and science is stronger than many teams assume. It spans books, academic references, training material, and community toolchains.
- ARCHER2: the UK national supercomputing service ran a February 2024 webinar on Blender for scientific visualisation, covering ParaView import paths and scripted Blender rendering inside Slurm jobs on HPC systems.
- IOPscience: frames Blender as a practical scientific visualization suite, not just a creative tool, through Brian Kent's book.
- NRAO resources: Brian Kent's scientific Blender tutorials cover star catalogs from ASCII files, transparent data cubes, a Martian surface map, magnetic fields, rigid body physics, and N-body galaxy collisions.
- Research and outreach talks: Kent also presented 3D scientific visualization with Blender at the University of Illinois New Frontiers Initiative in 2019, covering models, textures, animation, and camera control for research data.
- Community add-ons: Molecular Nodes on the Blender Extensions platform imports structural biology data and styles it in Geometry Nodes, with 2026 releases for Blender 5.1 and newer. Earlier projects such as BioBlender, CellBlender, and AstroBlend explored the same idea for biology, cell simulation, and astronomy.
That range matters because it confirms a practical truth. Blender already has enough maturity for serious research communication. The bottleneck is rarely the software. It is usually workflow design, data cleanup, and the team's discipline around reproducibility and rights management.
How should startups and SMEs define the fundamentals before touching Blender?
Core concept 1: Scientific visualization is not the same as scientific analysis
Definition: analysis tools answer whether the result is right, while visualization tools help people see what the result means. Blender sits mostly on the communication side, though Python-based scripting can also support structured data placement and scene generation.
Why it matters for startups: if you ask Blender to replace your solver, your team will waste time. If you ask Blender to turn validated outputs into investor-ready, regulator-friendly, or client-facing visuals, it becomes very strong.
Example scenario: a cleantech startup runs fluid simulations in specialist software, exports geometry and scalar fields through ParaView, then uses Blender for camera paths, labeling, section reveals, and branded render output for a grant application.
Core concept 2: Data provenance matters as much as image quality
Definition: provenance means you can trace where a visual came from, what source data was used, who modified the scene, and which version produced the final output. In legal terms, this can support authorship, ownership, and chain-of-custody arguments.
Why it matters for startups: if a scientific animation becomes part of a patent discussion, investor data room, or supplier dispute, a pretty MP4 without traceability can become a liability.
From Dirk-Jan Bonenkamp's legal angle, blockchain-anchored fingerprints and file event records are useful not because they sound futuristic, but because they help establish a tamper-resistant timeline. Blender files, exported meshes, and rendered deliverables can be linked to a wider file-history strategy, which is especially useful for SMEs that cannot afford long evidence battles.
Core concept 3: Simplification is not falsification when done transparently
Definition: scientific visuals often simplify color, density, motion speed, labeling, or context so viewers can understand the main signal. That is acceptable if the simplification is documented and does not misrepresent the result.
Why it matters for startups: teams often fear that any visual polish will look manipulative. The opposite problem is more common. They keep every artifact, every noisy contour, every irrelevant gridline, and then nobody can read the message.
Violetta Bonenkamp often argues from a founder's point of view that a visual should do work. If your animation cannot help a buyer, public funder, partner, or non-technical board member understand what the data proves, then it is a cost center rather than a business asset.
Need a practical Blender-to-business angle?
Blended BORIS covers not just creation, but also copyright logic, licensing, and commercial reuse for 3D assets that move across teams and platforms.
👉 Browse Blender business and IP guides
How do you implement Using Blender for Scientific Visualization step by step?
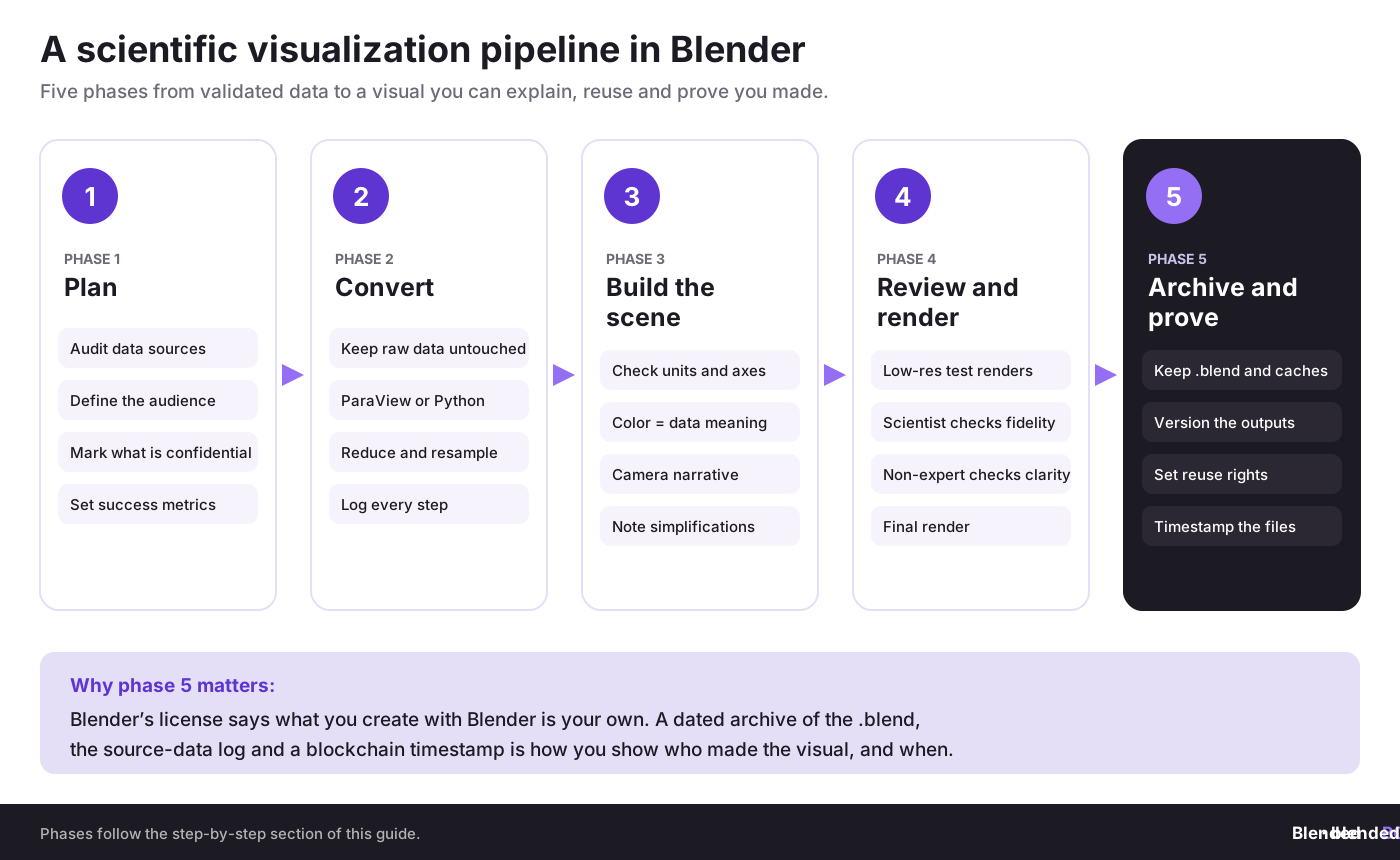
Let’s break it down. The most reliable method is to treat Blender as one stage in a documented pipeline rather than as a playground where files appear by magic.
Phase 1: Assessment and planning
- Audit your data sources. List your simulation tools, scan outputs, mesh formats, CSV files, VDB volumes, image stacks, and point clouds. Decide what will enter Blender directly and what needs conversion in ParaView, Python, or external preprocessing tools.
- Define the audience. A peer-reviewed conference visual, a medtech investor animation, and a machine maintenance explainer need different levels of detail and different annotation styles.
- Set legal boundaries early. Mark what is public, confidential, patent-sensitive, or export-controlled. This is where a CADChain-style governance mindset helps. A file that looks like “just a render” may expose geometry or trade secrets.
- Choose success metrics. Time to first draft, stakeholder approval cycle, render turnaround, error rate in labels, and reusable asset count are all more useful than vague aesthetic judgments.
Tools commonly used in this phase include Blender, ParaView, Python, spreadsheet-based metadata tracking, and versioned storage. If you are bringing in scans or real-world surfaces, clean geometry first, especially when raw scans are too noisy for credible scientific presentation. Check orientation and scale at the same time; our guide to Blender's coordinate system and X, Y, Z axes explains how Blender reads positions and directions.
Phase 2: Build the visualization foundation
- Normalize coordinates and scale. Scientific data often comes in units that are easy to break inside 3D scenes. Confirm metric scale, origin placement, and axis orientation before touching materials.
- Import or generate geometry. Use mesh exports, curve traces, particle objects, point instances, or volumetric data depending on your source.
- Create material logic. Do not pick colors because they look cool. Pick them because they separate states, thresholds, or categories. Keep a legend outside the render package if the visual is part of regulated communication.
- Build the camera narrative. Start wide, then isolate the phenomenon, then reveal change over time. Camera choreography is where Blender often beats raw technical software; see camera animation in Blender for the keyframe basics.
- Document assumptions. Note interpolation, time scaling, clipping, smoothing, decimation, and transparency choices. This protects credibility.
Phase 3: Test, render, and secure outputs
- Run low-resolution test renders. Catch mislabels, clipping errors, and impossible lighting before a full render queue starts.
- Review with both domain and non-domain viewers. A scientist checks fidelity. A non-specialist checks clarity.
- Prepare derivative files carefully. Final MP4, stills, .blend files, textures, caches, exported meshes, and presentation decks should have clear naming and version discipline. Our guide to auto-save and version control in Blender projects shows a setup that works for small teams.
- Register and store evidence. If the work has commercial or legal value, record timestamps, hashes, authorship, and usage terms. This is where blockchain-backed certificates or tamper-evident logs can support later proof.
- Package reuse rights. Internal use, conference use, investor use, and supplier use should not default to the same license.
Which workflows work best in Blender for scientific scenes?
1. ParaView to Blender for simulation storytelling
This is one of the most practical routes for CFD, thermal, and field data. ParaView handles scientific preprocessing well. Blender takes over for camera direction, compositing, annotation, environment control, and polished rendering. The ARCHER2 session explicitly points to this handoff for CFD results, and the same split works for thermal and structural data.
Here is how the main tools divide the work in a scientific Blender pipeline:
If render times grow with your datasets, compare EEVEE and Cycles before you commit to a render engine for a whole series.
2. Python-driven scene generation for repeatability
Blender's Python API matters a lot in science because manual scene assembly does not scale. If you produce hundreds of model variants or time-step sequences, scripted object placement, material assignment, render settings, and batch output keep the process reproducible. Kent's tutorials read star catalogs and data cubes with Python, and community add-ons build on the same API, so Python is a serious scientific entry point, not a side feature. Start with Blender scripting with Python if you have not automated a scene before.
3. Volume rendering for cubes, scans, and density fields
Voxel-like data, CT slices, astronomy cubes, and scalar density fields can become compelling in Blender when transparency is controlled carefully. The danger is visual mud. Blender imports OpenVDB (.vdb) files as Volume objects, so many teams convert grids to VDB first and shade them with the Principled Volume shader. Good volume renders need threshold discipline, limited palette noise, and camera angles that show depth without obscuring the signal. The volumetric lighting and fog guide covers the shader settings that also apply to data volumes.
4. Geometry Nodes and procedural setups for repeated structures
Repeated particles, molecular arrangements, point clouds, and vector indicators benefit from procedural control. If your scene depends on thousands of similar visual elements, procedural systems save time and reduce manual errors. Where motion or physics-style behaviors matter, there is a close link to physics simulations in Blender, especially when scientific communication needs controlled automation rather than hand-keyed movement.
What are the best practices that work in 2026?
Practice 1: Treat color as evidence, not decoration
- What it is: a disciplined palette tied to data meaning, thresholds, and viewer interpretation.
- Why it works: humans detect contrast and category separation quickly, but over-stylized gradients distort attention.
- How to implement: define your legend before rendering, test colorblind-friendly contrasts, and separate data-driven color from mood lighting.
- Common pitfall: mixing marketing colors with quantitative color logic.
- How to avoid it: keep data surfaces neutral and add brand colors in titles, frames, or interface overlays instead.
- Metrics to track: viewer error rate, time to comprehension, revision count after technical review.
Practice 2: Build scene templates, not one-off files
- What it is: reusable .blend templates for lighting rigs, label systems, camera defaults, render settings, and output naming.
- Why it works: scientific teams repeat similar jobs under deadline pressure.
- How to implement: create a base scene per data family such as medical, fluid, terrain, or molecular. Lock essential collections and naming rules.
- Common pitfall: every staff member invents a different scene structure.
- How to avoid it: standardize collections, units, and output folders.
- Metrics to track: setup time, onboarding time, and number of failed renders due to scene confusion.
Practice 3: Separate source data, visual intermediates, and final media
- What it is: three-layer file management. Raw scientific data stays untouched, Blender-ready derivatives sit in a controlled workspace, and final renders go to distribution folders.
- Why it works: this keeps your evidentiary trail clean and supports later updates.
- How to implement: use strict naming, version notes, and permission boundaries, as in our Blender file management best practices.
- Common pitfall: editing source-derived meshes without preserving their origin.
- How to avoid it: keep immutable raw folders and logged conversion steps.
- Metrics to track: reproducibility rate, file retrieval time, and number of disputes over “which version is final.”
Practice 4: Add legal metadata before publication, not after a dispute
- What it is: embedding authorship, date, project, license, and internal classification into your asset workflow.
- Why it works: by the time a render is on social media, in a partner deck, or inside a tender, memory is already unreliable.
- How to implement: define authorship records, export logs, and approved use cases at the moment of delivery.
- Common pitfall: teams assume screenshots or old emails are enough.
- How to avoid it: capture hashes, certificates, or other tamper-evident records when the asset is created and transferred. Our guide to art registration and provenance compares the options.
- Metrics to track: percentage of published assets with provenance records, dispute response time, and successful internal audit completion.
“Open-source does not mean ownerless. If your Blender scene carries scientific or commercial value, treat provenance as part of the workflow.”
Dirk-Jan Bonenkamp, CLO and co-founder, CADChain
What mistakes do engineering and scientific teams make most often?
Mistake 1: Importing dirty data and blaming Blender
Teams often feed Blender broken normals, impossible scales, non-manifold geometry, or chaotic point clouds, then complain that rendering looks wrong. The impact is wasted time and false conclusions about the tool. Avoid it by cleaning at source, checking units, and validating exports before scene building. If you already made this mistake, freeze the dataset, rebuild the conversion step, and compare outputs side by side.
Mistake 2: Chasing cinematic beauty at the expense of scientific legibility
Volumetric fog, dramatic depth of field, and glossy shaders can make a scientific scene harder to read. The impact is mistrust from reviewers and confusion among buyers or regulators. Avoid it by deciding which elements are illustrative and which are evidentiary. If you already over-stylized the render, create a stripped technical version and show both in review.
Mistake 3: No documented file ownership between employee, contractor, and company
This one becomes ugly fast, especially in EU startup teams that use freelancers across borders. The impact can include authorship disputes, blocked publishing, and broken marketplace licensing. Avoid it by assigning rights in contracts and linking scene files to project records. Dirk-Jan Bonenkamp's legal point here is simple: if creator and owner are different legal entities, your workflow must reflect that clearly.
Mistake 4: Publishing derived scientific visuals without reuse rules
A conference poster, investor deck, and supplier handoff should not grant the same downstream rights. The impact is uncontrolled circulation, repackaged visuals, and possible leakage of commercially sensitive geometry. Avoid it by setting use scope per output. If you already shared too widely, document recipients, issue updated terms, and archive evidence of prior distribution.
Mistake 5: Treating Blender files as disposable creative scraps
Many firms archive final MP4 files but lose the .blend, imported assets, and scene logic. The impact is inability to reproduce the work, update the visual, or defend authorship. Avoid it by storing working files under retention rules, with version notes and render settings. If you already lost scene history, recover what you can and start enforcing retention immediately.
How do you measure success in scientific Blender workflows?
A scientific visualization pipeline should be measured on clarity, repeatability, and defensibility, not just on whether people say the render looks nice.
Foundational metrics
- Time to first approved draft
- Technical revision count per project
- Viewer comprehension in review sessions
- Percentage of outputs with documented provenance
- Reuse rate of assets across projects
Advanced metrics after three months
- Conversion speed from raw data to Blender-ready scene
- Render cost per approved deliverable
- Number of legal or ownership questions resolved from logs alone
- Grant, sales, or investor success tied to visualization assets
- Asset licensing income from reusable scientific models or animations
For SMEs, a very practical dashboard includes project ID, data source, owner, creator, approval date, render version, allowed usage, and storage location. This sounds boring until someone asks who made a file, whether it can be reused commercially, or whether an external contractor still has access.
How should different company stages approach Blender scientific visualization?
Pre-seed and seed stage
Your reality: limited staff, high uncertainty, and pressure to explain a technical idea quickly. Approach: use Blender for one or two flagship visuals that clarify your core claim. Prioritize clear camera moves, trustworthy labels, and fast edit cycles. Defer advanced studio polish. Estimated resource need: one technically curious generalist plus part-time domain review. Success looks like a visual that helps a non-specialist understand your product or research in under two minutes.
Series A stage
Your reality: market proof is emerging, and external communication matters more. Approach: build repeatable templates, documented export paths, and version-controlled project folders. Prioritize consistency across investor decks, sales demos, grant reports, and recruitment material. Defer only the most custom pipeline tooling. Success looks like a small internal system, not isolated visuals.
Series B plus and established SME stage
Your reality: more departments, more legal exposure, more shared assets. Approach: formalize scene standards, access rights, archive rules, contractor agreements, and output licenses. Prioritize automation, provenance, and controlled distribution. Success looks like visualization becoming a trusted business function rather than an ad hoc design task.
Where do IP, copyright, trade secrets, and blockchain fit in?
This is where the CADChain angle becomes unusually useful. Many teams think scientific visualization is outside IP strategy because it is “just communication.” That is a mistake. A Blender scene can contain protected model geometry, original artistic choices, branded communication assets, and commercially sensitive data interpretations all at once.
Violetta Bonenkamp's position is that file-level protection should start where digital value starts. If your scientific Blender work supports a medtech prototype, advanced manufacturing pitch, aerospace concept, or grant-funded deeptech project, then you need more than folder discipline. You need proof of who created what, when, on whose instruction, under which license, and with which downstream rights.
Dirk-Jan Bonenkamp adds the legal caution. Copyright may protect original expressive choices in the scene, but it does not automatically solve trade-secret leakage, contractual ambiguity, or downstream recipient misuse. That is why practical rights management matters. A blockchain record is not magic, but it can support an audit trail when paired with real contracts, identity checks, and sensible file governance. Blender itself is free software under the GNU GPL, and the blender.org license page states that what you create with Blender is your sole property. BlendedBoris builds on that: it adds a blockchain timestamp to your Blender files from inside Blender, so each approved version of a scientific scene has dated evidence of authorship.
For EU SMEs, this matters in familiar settings:
- University spinouts: lab, founder, and contractor contributions are mixed.
- Cross-border subcontracting: Polish, Dutch, German, or Italian team members work on the same scene package.
- Grant-funded deliverables: publication rights and ownership terms may differ from commercial exploitation rights.
- Marketplace reuse: parts of a scientific scene may later be sold as generic assets or educational packs.
- Patent timing: a visual may reveal too much before filing if nobody reviews it carefully.
Can Blender-based scientific visuals become business assets, not just reports?
Yes, and many teams underprice this badly. A well-built scientific Blender scene can feed investor communication, sales demos, conference media, museum installations, training modules, simulation explainers, and even licensable stock or educational assets. That means the scene deserves the same business thinking as any other product-adjacent file.
Possible monetization and reuse paths include:
- Grant and public outreach packages for research consortia
- Investor explainer sequences for deeptech startups
- Training content for medtech, manufacturing, and engineering teams
- Licensable educational models derived from cleaned scientific geometry
- Conference booth loops and product launch visuals
- Media-ready science communication assets for press and public relations
The catch is simple. The moment an asset gets reused beyond its first purpose, ownership and licensing get messy if you did not structure them from day one.
Scientific visuals can become commercial assets.
If you plan to reuse Blender scenes across grants, marketing, teaching, or marketplaces, lock down authorship and licensing early so growth does not create legal chaos later.
👉 Read Copyright Basics for 3D Artists
What should your 30-day action plan look like?
Week 1: research and alignment
Audit current scientific data sources, identify one high-value use case, and define the audience. Review whether the visual is internal, public, commercial, or confidential.
Audit current scientific data sources, identify one high-value use case, and define the audience. Review whether the visual is internal, public, commercial, or confidential.
Week 2: pipeline setup
Choose import routes, standardize units, create a base .blend template, and set naming rules for scenes, caches, textures, and outputs.
Choose import routes, standardize units, create a base .blend template, and set naming rules for scenes, caches, textures, and outputs.
Week 3: first production test
Build one scene from real project data. Create both a technical review version and a communication version. Log every conversion and major artistic decision.
Build one scene from real project data. Create both a technical review version and a communication version. Log every conversion and major artistic decision.
Week 4: rights and reuse controls
Assign creator and owner, define allowed use cases, archive the working scene, register timestamps or hashes, and prepare a share-safe package for external viewers.
Assign creator and owner, define allowed use cases, archive the working scene, register timestamps or hashes, and prepare a share-safe package for external viewers.
Glossary of terms that matter in this context
Scientific visualization: The visual representation of scientific or engineering data so that structures, relationships, and changes can be understood.
CFD: Computational Fluid Dynamics, a class of simulation methods used to model fluid flow, heat transfer, and related behavior.
ParaView: An open-source scientific data analysis and visualization tool often used before Blender in simulation workflows.
Volume rendering: A method for displaying 3D scalar fields such as CT data, astronomy cubes, or density distributions.
Provenance: The documented history of a file, including source, modifications, authorship, and version chain.
Trade secret: Confidential business information that derives value from not being generally known.
Blockchain certificate: A record linked to a tamper-evident ledger that can support proof of existence, authorship timeline, or transfer history.
Derived asset: A new file or media output created from source data, such as a render, cleaned mesh, or educational model.
Key takeaways
- Using Blender for Scientific Visualization is a communication and business workflow, not just a rendering trick.
- Blender works best when paired with validated source tools like ParaView, scan preprocessing, or domain-specific solvers.
- Strong visuals need strong provenance. File ownership, licensing, and version history matter for startups and SMEs.
- The most common failure is not technical weakness but workflow chaos. Dirty data, unclear rights, and undocumented simplifications cause most downstream problems.
- In 2026, the teams that win are the ones that make science readable and defensible at the same time.
Closing thoughts
Blender has earned its place in scientific visualization because it helps technical teams show meaning, not just output. It can turn a simulation into a narrative, a scan into a training asset, and a complex model into a funding tool. Yet the real professional move is to pair visual craft with governance. That means cleaner pipelines, clearer ownership, stronger licensing, and evidence that survives beyond the excitement of the first render.
That is also where the CADChain founders' perspective is useful. Violetta Bonenkamp pushes the founder question: does this visual create real value or just look busy? Dirk-Jan Bonenkamp adds the legal test: can you prove where it came from, who owns it, and what others may do with it? If your answer to either question is weak, your Blender workflow is unfinished.
Next steps are clear. First, build one scientific scene properly from source to archive. Then strengthen your procedural side, your automation, and your scene systems. If that is the direction you want to take, the natural next read is Geometry Nodes Introduction: Procedural Animation, because the moment your scientific visuals start scaling, procedural control stops being optional.
Make your scientific visuals provable, not just pretty.
Before a render goes into a grant report, investor deck, or partner handoff, timestamp the .blend and its outputs. BlendedBoris works inside Blender and records a blockchain timestamp for each version, so you can show who made the visual and when.
👉 Timestamp your Blender work with BlendedBoris
People Also Ask:
Do scientists use Blender?
Scientists increasingly use Blender to display data in three-dimensional formats, creating visual representations that are helpful for analysis, communication, and educational contexts. Its ability to import datasets and map values to visuals makes it a valuable tool across disciplines.
What is the Blender course for scientific illustration?
Courses on Blender for scientific illustration provide essential training, starting with software installation, workspace setup, and introductory modeling. They aim to equip students, researchers, and educators with skills to create 3D visualizations for academic papers, presentations, and research outreach. For structured options and certificates, see advanced Blender courses and certifications.
Will Blender be forever free?
Blender is free and open-source software released under the GNU GPL, so anyone can use it for any purpose, including commercial and scientific work. Development continues through the Blender Foundation and Blender Institute, funded largely by the Development Fund, which supports long-term accessibility for users of all backgrounds.
Is Blender written in C or C++?
Both. Blender is written mainly in C and C++, and much of the core has moved to C++ over recent releases. Python is used for the user interface scripts, add-ons, and the scripting API. Blender runs on Linux, macOS, and Windows.
What are the benefits of using Blender for scientific visualization?
Blender allows researchers to create detailed and accurate animations and visualizations of scientific data. The software accommodates various file formats and data types, provides tools for rendering complex models, and enables researchers to effectively communicate findings visually.
Can Blender handle large datasets for visualization?
Blender can render large scenes, but very large scientific datasets are usually reduced first. Teams filter, decimate, or resample data in ParaView or Python, then bring a manageable mesh, point set, or OpenVDB volume into Blender. Python scripting helps automate that preprocessing and the import of many time steps.
Is Blender suitable for creating animations for scientific projects?
Blender is highly effective for producing animations in scientific projects, offering tools for simulating phenomena, animating data-driven models, and exporting cinematic presentations meant for academic or public communication purposes.
Are there any free resources to learn Blender for science?
Yes. Free options include the official Blender Manual and Python API documentation, Brian Kent's scientific Blender tutorials hosted by NRAO, recorded HPC training webinars such as the ARCHER2 session on Blender, and community forums where researchers share workflows for scientific applications.
Can Blender be used for medical or biological data visualization?
Yes. CT or MRI stacks are usually segmented into surface meshes in medical imaging software, or converted to OpenVDB volumes, and then imported into Blender for modeling, labeling, and rendering. Biological structures can come in through add-ons such as Molecular Nodes, which imports protein data into Geometry Nodes.
Does Blender offer plugins for scientific visualization?
Yes, through third-party add-ons and extensions. Molecular Nodes, for example, imports and styles structural biology data, and many labs write small Python add-ons that import their own data formats, integrate computational outputs, and automate visualization workflows.
FAQ on Using Blender for Scientific Visualization
What are key skills to develop for effective scientific visualization in Blender?
Focus on Blender's material shaders, camera control, geometry nodes, and Python scripting. These enable clear visual storytelling by managing 3D data representation and automating workflows. Combine this with expertise in scientific datasets to align visuals with research accuracy. Check out Blender career paths in 2026 for professional growth ideas.
How does scientific visualization with Blender compare to ParaView?
ParaView excels in preprocessing, but Blender adds emotional resonance through polished rendering, camera direction, and visual clarity. Many teams use both tools: ParaView for data preparation and Blender for interpretive, audience-ready presentations.
What visualization challenges do startups often face when using Blender?
Challenges include cleaning messy data, overcomplicating visuals, and inadequately managing IP rights. Startups can address these by standardizing workflows, simplifying keyframes, and using tools like BlendedBoris to secure intellectual property. Explore the Blender copyright guide for protection tips.
What types of data are best suited for Blender visualizations?
Blender handles CFD data, medical models, volumetric scans, and astronomy visuals excellently. Its handling of complex datasets through material shading and geometry manipulation makes it especially valuable for point clouds, molecular structures, and terrain maps.
Can startups monetize scientific visuals created in Blender?
Absolutely. Scientific Blender assets can be sold as educational models, included in grant communications, or licensed for media and training use. Proper IP management ensures reuse rights for commercialization opportunities.
What should teams document during the Blender visualization process?
Document decisions on material logic, camera paths, annotated layers, and simplifications. Keep an audit trail for datasets, sources, and export processes to maintain provenance, especially for regulated or collaborative projects.
How important is color choice in scientific visualizations?
Color is crucial. Use intuitive, data-driven palettes to differentiate categories or thresholds. Avoid mixing branding colors with analytical gradients for credibility. Colorblind-friendly contrasts ensure accessibility for wider audiences.
How can Blender improve grant and investor communications?
Blender produces visuals that simplify scientific complexity for non-specialists, improving clarity in pitch decks and grant reports. Narrative-driven scenes with controlled animations make technical results relatable.
What is the benefit of Python scripting in a scientific Blender workflow?
Python scripting automates repetitive tasks, such as object placements and batch rendering. It enhances scalability, precision, and reproducibility in scientific visualizations, especially in time-sensitive workflows.
What legal steps should teams take when sharing Blender visualizations?
File provenance is essential to avoid misuse. Secure rights, timestamps, and version control before distribution. Blockchain-based proofs add an extra layer of protection for sensitive visuals.


